trading
Calibration and Brier Scores: Measuring Your Prediction Market Accuracy
- trading
- kalshi

Calibration and Brier Scores: Measuring Your Prediction Market Accuracy

In the domain of quantitative finance and prediction markets, the accuracy of forecasts is paramount. Two essential concepts in evaluating prediction accuracy are calibration and the Brier score. Understanding these metrics can significantly impact decision-making processes, especially when building trading models that rely on probabilistic predictions.
Understanding Calibration
Calibration refers to the alignment between predicted probabilities and observed outcomes. A well-calibrated model will produce probability estimates that reflect actual frequencies over time. For instance, if a model predicts a 70% chance of a certain event occurring, then, over numerous events, this should occur approximately 70% of the time. Calibration provides a qualitative measure of how trustworthy the predictions are.
Example of Calibration in Prediction Markets
Let's consider a predictive market for a sports event where a trader forecasts the home team will win with a probability of 0.75. Over the course of several games, if you observe that the home team wins 75 out of 100 times when this prediction is made, the model is well-calibrated. Conversely, if the home team only wins 50 out of 100 times, the model indicates it is overconfident in its predictions.
Measuring Calibration
Calibration can be visually assessed using reliability diagrams, which plot predicted probabilities against actual outcomes. If the points cluster closely along the diagonal line (where predictions equal observed frequencies), the model is well-calibrated.
Brier Score: A Quantitative Measure
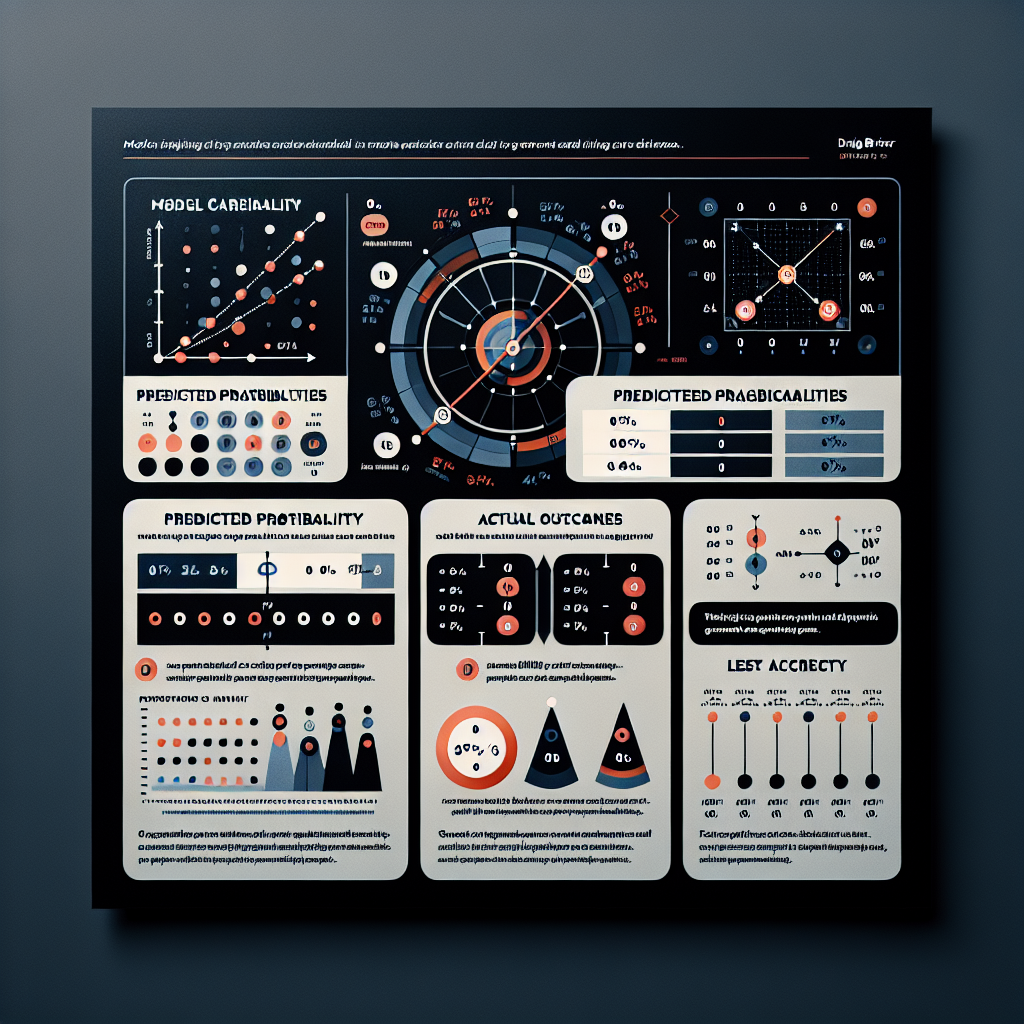
The Brier score quantifies accuracy by measuring the mean squared difference between predicted probabilities and the actual outcomes. This score ranges from 0 to 1, where 0 indicates perfect accuracy, and 1 indicates the least accuracy. The Brier score is especially useful because it incorporates both calibration and sharpness (how confident predictions are).
Formula of Brier Score
The formula for the Brier Score (BS) can be expressed as:
[ BS = \frac{1}{N} \sum_{i=1}^{N} (f_i - o_i)^2 ]
Where:
- ( N ) is the number of predictions,
- ( f_i ) is the forecasted probability for event ( i ),
- ( o_i ) is the actual outcome (1 or 0, for event occurrence or non-occurrence).
Practical Application of Brier Score in Trading
In quantitative trading, Brier scores can help evaluate model performance, especially when trading strategies hinge on forecast probabilities such as volatility predictions or market movements.
Example: Evaluating a Trading Strategy
Consider a model predicting the price movement of a cryptocurrency. A trader creates a model predicting a 60% chance that Bitcoin will rise in the next hour. If Bitcoin does rise in that hour, we assign ( o_i = 1 ) and ( f_i = 0.6 ).
To calculate the Brier score, consider this over multiple predictions:
- Prediction 1: ( f_1 = 0.6, o_1 = 1 )
- Prediction 2: ( f_2 = 0.7, o_2 = 0 )
- Prediction 3: ( f_3 = 0.4, o_3 = 1 )
The Brier score calculation becomes:
[ BS = \frac{1}{3} [(0.6 - 1)^2 + (0.7 - 0)^2 + (0.4 - 1)^2] = \frac{1}{3} [0.16 + 0.49 + 0.36] = \frac{1.01}{3} \approx 0.34 ]
This output indicates a relatively good prediction performance, but there is room for improvement.
Implementing Calibration and Brier Scoring in Python
To effectively evaluate calibration and the Brier score using Python, libraries like scikit-learn and matplotlib can be leveraged. Below is an example of how to compute and visualize calibration and Brier scores.
Code Example
import numpy as np
import matplotlib.pyplot as plt
from sklearn.calibration import calibration_curve
from sklearn.metrics import brier_score_loss

# Predicted probabilities and actual outcomes
predicted_probabilities = np.array([0.6, 0.7, 0.4, 0.8, 0.3])
actual_outcomes = np.array([1, 0, 1, 1, 0])

# Calculate Brier score
brier_score = brier_score_loss(actual_outcomes, predicted_probabilities)
print(f"Brier Score: {brier_score}")

# Calibration Curve
prob_true, prob_pred = calibration_curve(actual_outcomes, predicted_probabilities, n_bins=5)
plt.plot(prob_pred, prob_true, marker='o', label='Calibration Curve')
plt.plot([0, 1], [0, 1], linestyle='--', label='Perfectly Calibrated')
plt.title('Calibration Curve')
plt.xlabel('Mean predicted probability')
plt.ylabel('Fraction of positives')
plt.legend()
plt.show()
Assessing Market Structure with Calibration and Brier Scores
In prediction markets, calibration and Brier scores play an essential role in assessing market structure. Traders often exploit price inefficiencies by measuring their predictive capabilities. A calibrated market implies efficient price formation, while significant miscalibration may offer opportunities for arbitrage.
Example in a Market Setting
Suppose two prediction markets are established for the same event but yield different predictions. If one market shows a probability of 0.75, while another shows 0.60, arbitrageurs will likely take positions based on their models’ accuracy and calibration. The market with the lower calibration may present a lucrative opportunity for profit if traders can bet in accordance with their predictive capabilities.
Conclusion
Calibrating your probability predictions and understanding the Brier score are vital steps in improving accuracy in prediction markets and trading strategies. By implementing these metrics, traders and quantitative builders can create better predictive models that not only yield more reliable forecasts but also create profitable trading opportunities. Consistently measuring and evaluating your model's performance empowers a more disciplined approach to trading. In a competitive landscape, the ability to accurately assess and improve predictions can be the difference between profit and loss.